1872-2020 SP500 index : a [time, mind]-bending perspective
"... History never repeats itself, but it rhymes. ..."
Table of Contents
"Key [results, comments]"
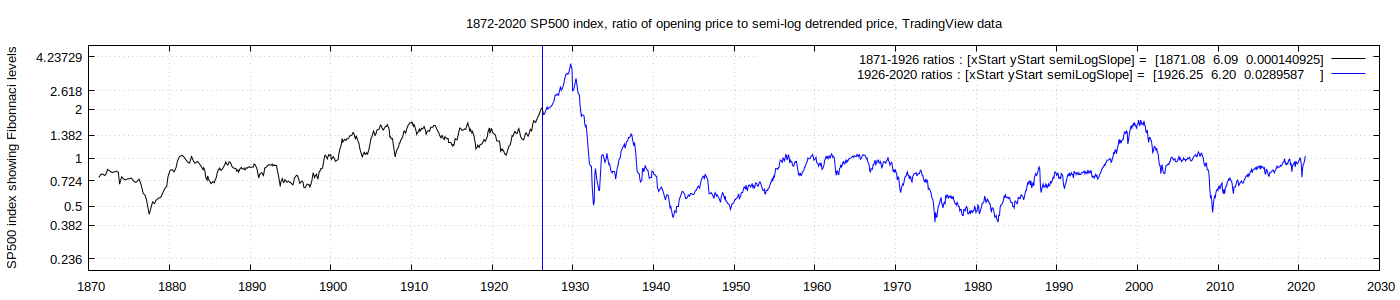
Standard & Poor's index of stock market prices for 500 large capitalisation companies (SP500) from 1872 through 2020 is shown in the semi-log plot below. Two "eyeballed" linear trend lines are shown for the periods [1872-1926, 1926-2020].
 and (1926-2020).png)
The ratio of the historical SP500 price to its semi-log trend price for the same date is plotted in the graph below. The price scaling is according to Fibonnacci ratios, as commonly used by many stock market technical analysts, which I often find to be helpful or at least interesting, as it so often provides convenient matches with data series.
The real fun starts when I rather [arbitrarily, haphazardly] copy-pasted sections of the graph from the 1950-2020 timeframe, and shuffled them to lie over sections of the 1872-1960 section of the original graph. Here is one possible result :
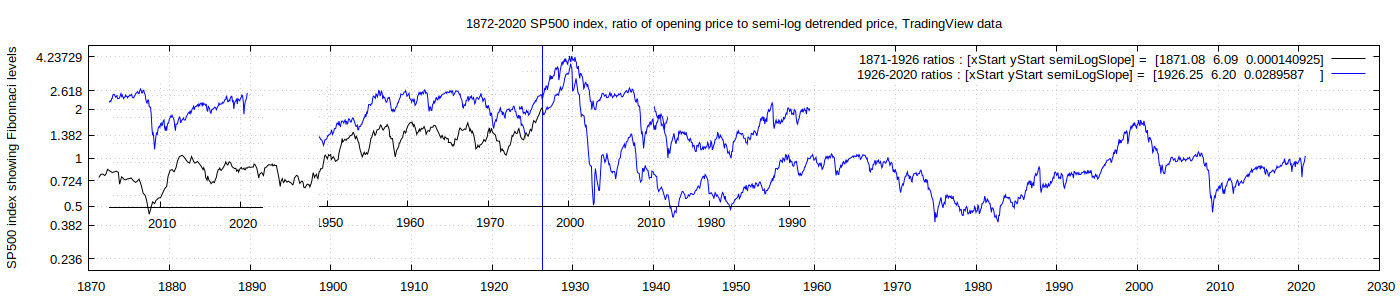
Wow! Even knowing that the [eyes, mind] often see patterns that aren't really there (as per random noise), one can basically re-create the essence of the 1872-1960 timeframe simply by copying ONLY 4 chunks of the 1950-2020 time-frame!! Of course, there is nothing new about this - TradingView members are often comparing current market squiggles to the past, over different timescales. I would actually be surprised if the aqbove graph hasn't already been done hundreds of times before. [System_T, Amjad Farooq, TexasWestCapital, perhaps Harry Dent] and others are examples of recent pattern-matching for the SP500, with their comparisons of the 2020 crash to other time periods. But my overlays in the graph above above did not involve [re-scaling, rotating] or other transformation of the time segments, transparencies], so that is [noteworthy, simple, pure]. Scale is important, even if only to confirm the applicability of multi-scalar processes.
You will notice that I was too cowardly to fill in the 1890-1900 section with an overlay, perhaps from ~1970-1980. That would be equivalent to a forecast of sorts, but what I learned from commodity chemical market research is that "Forecasting is a particularly hazardous occupation, especially if you try to apply it to the future". I also feel that it is "dangerous" to have only one forecast, just as it is dangerous to "believe" only one scientific theory, even if it is an overwhelmingly dominant mainstream consensus science theory-cum-cult-cum-religion. I try to force a "multiple conflicting hypothesis" attitude on myself, even if I have to find a really [defunct, dishonest, abandoned] theory. Otherwise, I often find that I become a tool of the theory, rather than the theory being a tool to be used if and when [desired, needed, appropriate]. Most of all, a theory should NOT become an impediment to [thinking, progress], as is far too often the case.
So maybe YOU can generate forecasts, not necessarily with the transparency overlays.
Play with the [time, mind]-bending perspective yourself
While you probably don't have the gimp (GNU image manipulation program) installed on your computer (yet), it is available for free (I think on MS Windows as well, not just Linux?). With gimp, you will be able to work with my .xcf format file SP500 time-section transparencies. If you are new to gimp, be prepared to lose a lot of hair and gain a lot of wrinkles - it's not the the easiest learning curve, but it is powerful (and cheap!).
You can move these transparencies around in gimp (but not in the image above, which is a jpg format). Furthermore, you can do your own models by copy-paste of sections of a graph, and moving them around. Of course, with the [spreadsheet, .dot text] files, you can impose your wown data transformations as well.
Deja Vu all over again (Yogi Berra) : - This "chopping up a time series" and omitting sections to recreat a time seeries with a model is eerily familiar :
- 7,500 years of history - This is the same challenge that I had with a [lunitic, scattered, naive] model of history by my father and I, where it was necessary to cut ?150? years out of a 7,500 year time series to "kind of make it fit". Steven Yaskall recognized us as the "two fools who rushed in" in his book "Grand Phases on the Sun". We were justifiably proud of that.
- "cut & paste" versus standard [statistics, correlations, regressions, models, theories, ] Am I halucinating, or are a few rare deep learning NN researchers going more modular?
- Smooth sinusoidal curves and regular periodicities - I seems that mathematicians and scientists still [think, apply] models assuming ideal waveforms, even when [their tools, reality] do not. Stephen Puetz's "Universal Waves Series" (UWS) is the most [powerful, fantastic] meta-level model for [natual, human] cycles that I have ever seen, by far. It even has an awesome probablistic-ranked list of expected timings of events at different timescales. However, perhaps more remains to be done on subtleshifts in real time series? I don't know - I'm just guessing.
- Reminds me of Piccasso "cubism", which I thought was a cheap parlor trick good enough to sucker intellectuals with money. But I may end up pulling my foot out of my mouth, as with Sigmund Freud being a primary inspiration of [ordered derivatives, control theory, consciousness] in the area of Neural Networks research. Paul Werbos' "ordered dereivatives" for neural networks (long before the mathematically inferior "backpropagation") plus his Adaptive Dynamic programming concepts, and John Taylor's theory of consciousness, are examples of Freud's very modern [influence, inspiration].
- Vladimir Vapnik, father of statistical learning theory - "Engineers and scientists, you must eventually abandon your theories as you reach the point when only the data can go further." (a bit of a mis-quote)
Perhaps this section is saying something important about an over-reliance of modern approaches on [modelling, statistics], at the expense of simple pattern-matching? And perhaps it is just me who has this problem...
Furthermore, a key lesson may be what I have long felt for [physics, astronomy, climate, etc] series : the real challenge isn't prediction of the next steps in a time series, but to predict [when, to which state] a system will change in the future.
Ratio of actual to semi-log detrended data : [advantages, disadvantages]
Time greatly distorts the measuring sticks for [money, economics, finance, markets], so it is very important to convert the data before making comparisons across time. This web-page uses a simple semi-log conversion of the S&P500 index opening prices from 1872 to 2020. While other basis such as adjustments with [Producer, Consumer,]-Price Indexes or populations might be better in some ways, the current approach has the advantage that it does not [distort, polute] the data at an early stage, and it is very [easy, clear] to double-check results.
For sure, one would normally do a simple linear regression to generate the [xStart, yStart, slope] parameters for the trend lines for [1872-1926, 1926-2020], however, at this preliminary stage it is more important for me to look at the data and to avoid facetious levels of [accuracy, certainty, self-delusion]. The eye is often much better than ordinary analysis.
line
This "semi-log detrended" format has many advantages :
- Partial compensation for the unstable pricing measure - As discussed earlier, a log scale for pricing may not be the best correction, but it's a start, and it avoids very problematic interpretations and sadjustments of pricing indexes. This makes for a fast, easy] start. and a basis of comparison when you don't trust the standard pricing adjustments, which are subject to [political influence, knowers of the truth, stupidity].
- Horizontal trend - Because the core trend is horizontal, long-time=period graphs can maintain maximum variation from the trend, making it much easier to see details.
- Visual compression of slow market rises, expansion of market declines - As SHOULD be expected, nominal dollar plots must be corrected for the trend-line. I was going to create an illustration of this using the [1929, 2008] market rise-crashes, but that will have to wait for another day.
- No extra data influences - Only the SP500 data is used to producing the detrended ratios! This is a big advantage for a starting point.
- 16Sep2020 ... I'll have to fill this list at a later date...
-
Some disadvantages of the format are :
- Unfamiliar - It's hard to adapt to a differnt form of a long-known and understood time series. This is a big challenge for me and others (a bit like converting from English to metric units).
- Partial compensation for the unstable pricing measure - As noted above, a semi-log plot is NOT a solid [correction, adjustment] of pricing over time. It would be important to introduce that eventually, although it's not clear that standard indexes would be good enough.
- Induced beliefs - The better correlations apperar, the more likely that they can have undue influence over [beliefs, analysis]. To me, it's important to have "multiple conflicting hypothesis".
- 16Sep2020 ... I'll have to fill this list at a later date...
-
Future potential work
It's unlikely that I will get much time for this, but here are some ideas that could be interesting.
- Obvious step - apply to multiple time scales, especially for traders (a few days to few months). This will likely require different ideas to effectvely handle common technical indicators.
- Mandelbrot's "multi-fractals" - in his book "Misbehaviour of Markets", Mandelbrot was insistent that the true power of fractals comes out with "multifractals", for which time is a fractal dimension.
- Fractional ordered calculus - This was a total shock to me in ~2013-2015, when I peer-reviewed a journal article with that phrase in the title. I couldn't believe how blind, dumb] I had been to completely miss this, even with Mandelbrot's "multi-fractal" warning!! Goes way back to a guy called Liebnitz - just think of the great war between him & Isaac Newton over who invented calculus. The ancient Greeks would have a very different opinion on that war.
- 16Sep2020 ... I'll have to fill this list at a later date...
Comparison of [TradingView, Yahoo finance] data
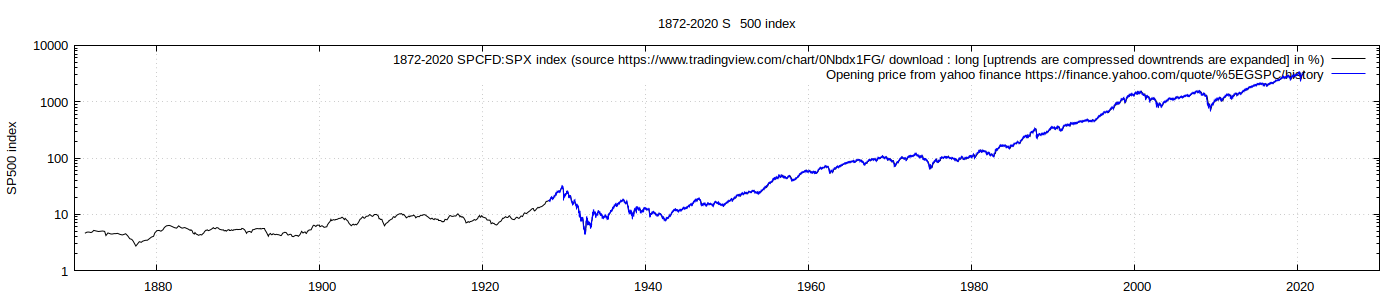
It's always important to use several sources of data, where possible. [errors, fraud, deception, incomplete disclosure, mis-understood] data treatments aren't rare in science (I don't know about [economics, markets]). But more important is that I may not have understood the [data, analysis, modelling, reality] or it's limitations well enough. Here I merely compare two sources of the same data, which brings some confidence.
TradingView versus yahoo finance - the data series are essentially the same, as no black curve excursions above, below the blue yahoo curve are seen.
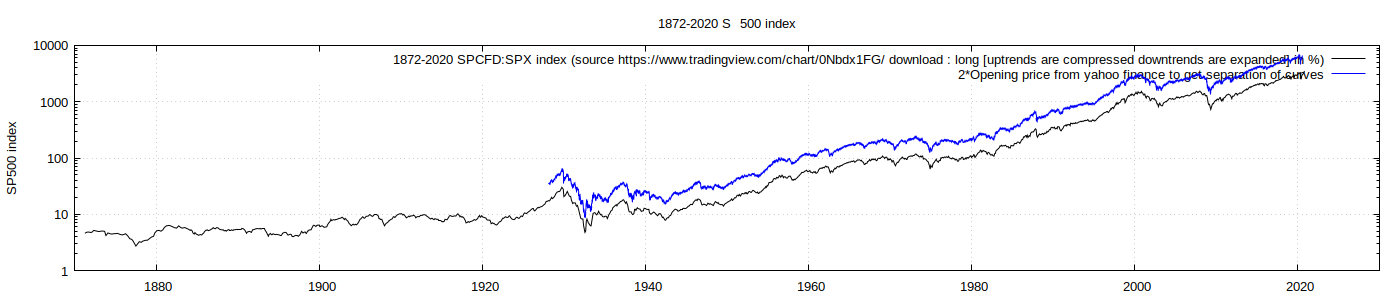
TradingView versus 2 times yahoo finance - by multiplying the yahoo data by 2, it is much easier to see the essentially perfect similarity of the data series. This helps as the first comparison above leaves me thinking that maybe something is missing.
[data, software] cart [description, links]
While most results are provided in sections above, links to data [spreadsheets, text files] and software [???, source code] are listed below along with brief comments. A full listing of files (including other SP500 web-pages) can be seen via this Directory's listing. Hopefully this will help those who want to do something different, as the programs etc mayhelp with [learning, debugging].
Data :
- TradingView data text file and spreadsheet - I had to upgrade my TradingView subscription to Pro+ to download the data for years prior to 1928, as I couldn't find another source. Note that the S&P500 index started in 1926, so I assume that proxy [data, index memberships] were used for prior years. I used the spreadsheet to [gather, view, process] data, and copied the resulting tables to text files for use by gnuplot (see "Software" below).
- Yahoo finance data (23Feb2023 the text file has been lost, but the data is in the linked spreadsheet with TradingView data). I was happy to have another "somewhat independent" data source, even if they are both from the same S&P or other source. This really helps as a check on my data treatment (see the section above "Comparison of [TradingView, Yahoo finance] data").
Software :